
Operational efficiency measures how effectively an organization converts inputs-labor, materials, capital, time-into outputs while minimizing waste and maximizing value. Organizations achieving high operational efficiency deliver consistent quality at lower cost, respond faster to market demands, and sustain competitive advantages. This capability directly impacts profitability, customer satisfaction, and long-term viability across manufacturing, distribution, service delivery, and technology sectors.
TL;DR:
- Operational efficiency is the ratio of output value to input cost, optimized through process improvement, waste elimination, and resource utilization
- Measure efficiency using labor productivity, asset utilization, cycle time, defect rates, and cost per unit metrics
- Implement efficiency gains through lean principles, automation, standardization, real-time data, and continuous improvement
- Technology solutions including custom software, workflow automation, and field service management software enable measurable efficiency improvements
- Successful programs require executive sponsorship, cross-functional collaboration, baseline measurement, and iterative refinement
What Is Operational Efficiency and Why Does It Matter?
Operational efficiency is a performance measurement comparing the quality and quantity of outputs produced to the resources consumed in production or service delivery. An operationally efficient organization minimizes input costs-including labor hours, raw materials, energy, and capital equipment-while maintaining or improving output quality, speed, and consistency.
This concept differs from productivity, which measures output volume alone. Operational efficiency encompasses quality, waste reduction, resource optimization, and process repeatability. A production line producing 1,000 units per day with 15% defect rates is productive but inefficient. The same line producing 950 units with 2% defects demonstrates superior operational efficiency through better resource utilization and lower total cost.
Organizations prioritize operational efficiency for three strategic reasons. First, efficiency improvements directly increase profit margins by reducing the cost of goods sold or service delivery without proportional revenue reductions. Second, efficient operations respond faster to demand fluctuations, quality issues, and supply disruptions. Third, efficiency creates competitive advantages in price-sensitive markets where margins compress and customers demand faster delivery.

The Lean Enterprise Institute defines operational efficiency through waste elimination across seven categories: overproduction, waiting, transportation, inappropriate processing, excess inventory, unnecessary motion, and defects. Addressing these waste sources creates compound improvements in throughput, quality, and cost structure.
Key Performance Indicators for Operational Efficiency
Organizations measure operational efficiency through quantitative metrics aligned with specific operational contexts:
| Metric Category | Key Indicators | Calculation Method | Target Benchmark |
|---|---|---|---|
| Labor Productivity | Output per labor hour | Total output / total labor hours | Industry-specific |
| Asset Utilization | Equipment uptime | Operating time / available time | 85-95% |
| Process Speed | Cycle time | End time – start time | Minimize variation |
| Quality | First-pass yield | Accepted units / total produced | >95% |
| Cost | Cost per unit | Total costs / units produced | Year-over-year reduction |
Labor productivity measures how much value each employee hour generates. Manufacturing contexts track units produced per shift, while service organizations measure billable hours, tickets resolved, or revenue per employee. Declining productivity signals process bottlenecks, skill gaps, or inadequate tooling.
Asset utilization quantifies how effectively capital equipment operates during available production time. Utilization below industry benchmarks indicates maintenance issues, scheduling inefficiencies, or demand-capacity mismatches. Service maintenance programs directly impact utilization through preventive maintenance, faster repairs, and condition monitoring.
Cycle time measures the duration from process initiation to completion. Shorter cycle times indicate efficient workflows, minimal handoffs, and reduced work-in-progress inventory. Variability in cycle times reveals inconsistent processes requiring standardization.
How Do You Calculate Operational Efficiency?
Operational efficiency calculations compare actual performance to theoretical maximum capacity or industry standards. The basic formula expresses efficiency as a percentage:
Operational Efficiency = (Actual Output / Standard Output) × 100
Standard output represents the expected production given available inputs under normal operating conditions. This baseline comes from engineered standards, historical averages, or industry benchmarks. An operation producing 850 units when standard capacity allows 1,000 units operates at 85% efficiency.
More sophisticated approaches account for quality and cost:
Total Efficiency = (Good Units Produced / Theoretical Maximum) × (Standard Cost / Actual Cost) × 100
This formula penalizes operations producing high volumes with quality defects or excessive resource consumption. A process running at 95% capacity utilization but generating 10% scrap operates at lower total efficiency than a 90% utilization process with 2% scrap.
Step-by-Step Efficiency Measurement Process
- Define output units – Establish clear, countable outputs relevant to your operation (units produced, orders fulfilled, tickets closed, projects completed)
- Identify all inputs – Document direct labor hours, materials consumed, machine hours, energy usage, and overhead allocations
- Establish baseline standards – Determine expected output levels under normal conditions through time studies, historical data, or industry benchmarks
- Collect actual performance data – Measure real outputs and inputs over consistent time periods (shift, day, week, month)
- Calculate efficiency ratios – Apply formulas comparing actual to standard performance across relevant metrics
- Analyze variance drivers – Investigate gaps between actual and standard to identify root causes (equipment issues, training needs, material quality, process design)
- Implement corrective actions – Address identified inefficiencies through targeted improvements
- Track trends over time – Monitor efficiency metrics continuously to detect degradation or validate improvements
Organizations achieving sustained efficiency gains measure performance in real-time rather than monthly or quarterly intervals. Immediate feedback enables rapid response to deviations before they compound into significant waste.
What Are the Most Effective Strategies for Improving Operational Efficiency?
Operational efficiency improvements follow structured methodologies that identify waste sources, redesign workflows, and optimize resource allocation. Five evidence-based strategies deliver measurable results across industries.
Process Standardization and Documentation
Standardizing workflows eliminates variation, reduces training time, and enables continuous improvement. Documented standard operating procedures (SOPs) define the single best method for completing each task, incorporating lessons learned from previous errors and successes.
Organizations implementing standardization first map current-state processes to visualize handoffs, decision points, and delays. Process mapping reveals redundant steps, unclear responsibilities, and bottlenecks consuming disproportionate time. The next step redesigns workflows to eliminate non-value-adding activities, reduce handoffs, and clarify ownership.
Digital service forms replace paper-based checklists with structured digital workflows that enforce standardization while capturing completion data for analysis. Technicians follow identical procedures for similar tasks, ensuring consistent quality regardless of individual experience levels.
Lean Principles and Waste Elimination
Lean methodology systematically removes eight categories of waste: defects, overproduction, waiting, non-utilized talent, transportation, inventory, motion, and extra processing. Each waste type consumes resources without creating customer value.
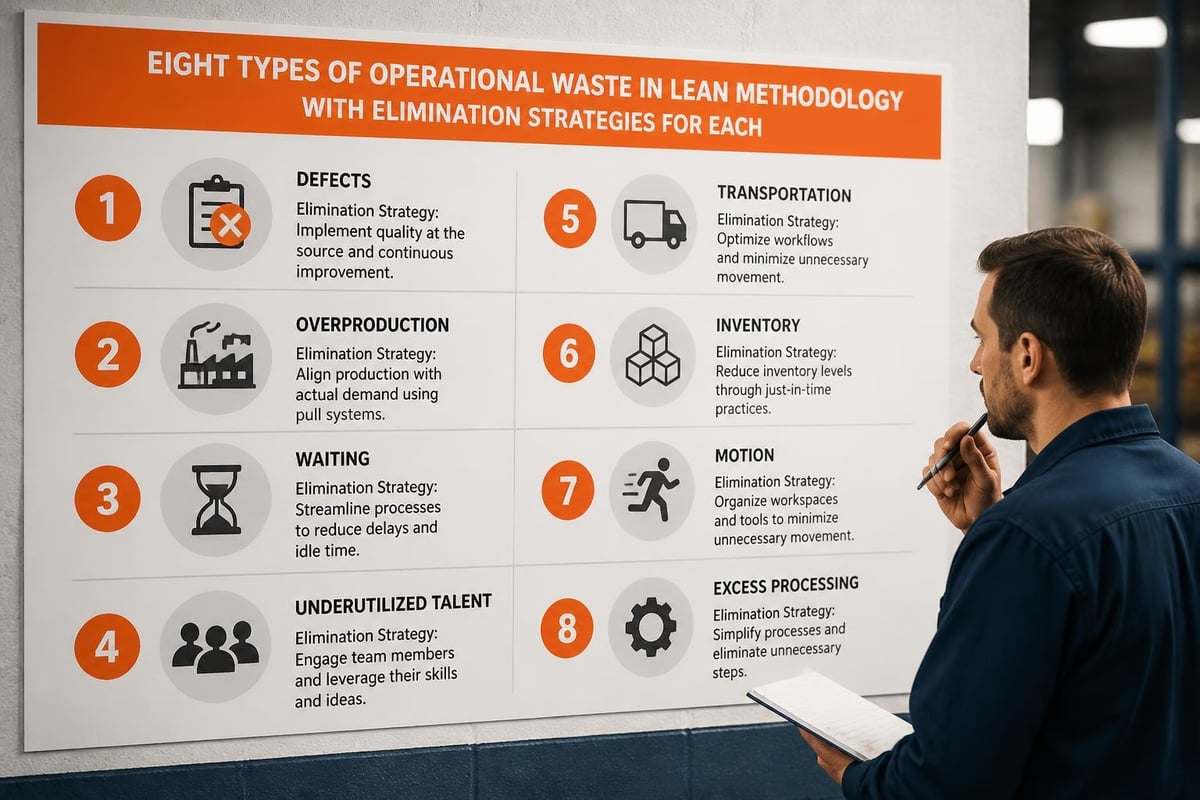
Defects require rework, consume materials, and delay delivery. Root cause analysis identifies why defects occur-inadequate specifications, insufficient training, faulty equipment, or poor-quality inputs. Corrective actions address underlying causes rather than symptoms.
Waiting occurs when materials, information, or approvals delay production. Analyzing wait times across process steps reveals scheduling mismatches, approval bottlenecks, and information gaps. Solutions include demand leveling, decision authority delegation, and buffer inventory at constraint points.
The environmental and operational performance impacts of lean and green practices demonstrate how waste reduction simultaneously improves efficiency and sustainability. Energy consumption per unit, material waste percentages, and emissions intensity all decline when organizations eliminate process waste.
Automation and Technology Integration
Automation eliminates manual tasks prone to errors, variation, and delays while freeing human workers for judgment-intensive activities. Effective automation targets high-volume, rule-based processes where consistency matters more than flexibility.
Manufacturing automation includes robotic assembly, automated material handling, and machine vision inspection systems. Service organizations automate data entry, report generation, scheduling, and customer communication. Administrative automation handles invoice processing, expense approvals, and compliance documentation.
Custom software solutions integrate disparate systems to eliminate duplicate data entry, manual reconciliation, and format conversions. Brytend develops tailored automation that connects existing platforms-ERP, CRM, inventory management, and quality systems-creating unified workflows without ripping and replacing functional systems.
Implementation follows this sequence:
- Identify high-volume, repetitive tasks consuming significant labor hours
- Map current manual workflows including inputs, decision logic, outputs, and exceptions
- Evaluate automation feasibility based on process stability, rule clarity, and exception frequency
- Develop or configure automation tools matching specific workflow requirements
- Test automated processes against real scenarios including edge cases and error conditions
- Train users on monitoring automated processes and handling exceptions
- Monitor automation performance metrics (accuracy, throughput, error rates) and refine logic
The 2025 CEO priorities research from IDC found that 73% of executives view automation and AI as critical to achieving measurable operational efficiency gains over the next three years. Technology investments generating documented ROI through reduced labor costs, faster cycle times, or improved quality secure ongoing funding and organizational commitment.
Real-Time Performance Monitoring
Traditional efficiency measurement relies on lagging indicators reviewed days or weeks after problems occur. Real-time monitoring provides immediate visibility into operational performance, enabling rapid response to deviations before they escalate.
Modern operations deploy sensors, scanners, and connected devices capturing continuous performance data. Manufacturing equipment reports operating status, cycle counts, downtime reasons, and quality measurements. Service technicians log completion times, parts consumed, and issue resolution through mobile applications. Warehouse systems track inventory movements, pick accuracy, and order fulfillment speed.
Brytend's Service Module enables organizations to track serialized equipment throughout its lifecycle, monitoring service history, condition assessments, and maintenance schedules. This visibility prevents reactive failures that disrupt operations and consume resources on emergency repairs rather than planned maintenance.
Dashboard visualizations translate raw data into actionable insights. Operations managers view current efficiency metrics compared to targets, identify underperforming areas, and drill into root causes. Alert systems notify supervisors when metrics deviate from acceptable ranges, triggering immediate investigation.
Continuous Improvement Culture
Sustained operational efficiency requires organizational cultures where employees at all levels identify improvement opportunities, test solutions, and share results. Top-down mandates achieve initial gains but stall without frontline engagement.

Effective continuous improvement programs establish structured problem-solving frameworks like Plan-Do-Check-Act (PDCA) or Six Sigma's DMAIC (Define, Measure, Analyze, Improve, Control). These methodologies guide teams through disciplined analysis, experimentation, and standardization of solutions that work.
Organizations implementing improvement initiatives must capture lessons learned and disseminate successful practices. The Brytend Survey Module enables teams to document current conditions, collect employee suggestions, track improvement projects, and measure results through customized forms and automated reporting. Creating feedback loops where improvement efforts generate visible results builds momentum and participation.
What Common Mistakes Reduce Operational Efficiency?
Organizations pursuing efficiency improvements frequently encounter predictable obstacles that diminish results or create unintended consequences. Recognizing these patterns enables proactive mitigation.
Optimizing silos instead of end-to-end processes – Improving individual department efficiency often shifts problems downstream. A purchasing team minimizing unit costs by ordering large batches creates inventory carrying costs and obsolescence risk. A production team maximizing machine utilization by running large lots increases work-in-progress inventory and delivery lead times. Effective efficiency programs optimize complete value streams from customer order to delivery rather than isolated functions.
Measuring activity instead of outcomes – Tracking hours worked, reports generated, or meetings attended creates busyness without productivity. Efficiency metrics must connect to business results: revenue per employee, cost per unit produced, on-time delivery percentage, or customer satisfaction scores. Activity metrics serve as diagnostic tools when outcome metrics deteriorate but should not become primary performance indicators.
Implementing technology without process redesign – Automating broken processes preserves inefficiencies at higher speed and scale. Software cannot compensate for unclear responsibilities, excessive approval layers, or unnecessary steps. Process improvement must precede technology implementation. Map workflows, eliminate waste, standardize procedures, then automate optimized processes.
Ignoring change management and training – New systems and procedures fail when users lack understanding, skills, or motivation to adopt them. Efficiency initiatives require communication explaining why changes matter, training demonstrating how new methods work, and support addressing problems during transition periods. Frontline employees possess critical knowledge about current process problems and potential solutions. Engaging these stakeholders early improves design quality and adoption rates.
Cutting resources beyond optimal levels – Efficiency improvements enable resource reduction while maintaining output, but excessive cuts damage operational capability. Eliminating all inventory buffers creates vulnerability to supply disruptions. Reducing headcount below minimum coverage requirements forces overtime, increases errors, and accelerates turnover. Sustainable efficiency balances waste elimination with necessary capacity reserves.
How Does Technology Enable Operational Efficiency Gains?
Technology serves as an efficiency multiplier when properly selected and implemented. Modern operations rely on four technology categories delivering documented returns.
Enterprise Resource Planning (ERP) Integration – Unified platforms connecting finance, operations, inventory, and customer management eliminate duplicate data entry, reconciliation errors, and information delays. Single-source data enables real-time visibility into resource availability, order status, and financial performance. Organizations transitioning from disconnected spreadsheets and legacy systems to integrated ERP report 15-25% efficiency gains from reduced administrative overhead and improved decision-making.
Workflow Automation Platforms – Custom automation replaces manual handoffs, data transfers, and approval routing with triggered actions based on defined rules. When a customer submits an order, automated workflows verify inventory availability, check credit limits, generate pick lists, notify shipping personnel, and update financial records without human intervention. Exception handling routes unusual scenarios to appropriate decision-makers while processing standard transactions automatically.
Mobile and Cloud Solutions – Field personnel access current information, update records, and complete tasks from any location using mobile devices. Technicians view equipment service history, order replacement parts, and document completed work onsite rather than returning to offices for administrative tasks. Cloud platforms enable secure access without infrastructure investments while supporting remote and distributed teams.
The EPA’s industrial energy management guidance emphasizes how energy monitoring systems improve operational efficiency by identifying consumption patterns, detecting anomalies, and quantifying improvement opportunities. Facilities implementing continuous energy monitoring reduce consumption 10-20% through improved equipment scheduling, maintenance optimization, and waste heat recovery.
Analytics and Business Intelligence – Historical performance data reveals patterns invisible in daily operations. Analytics platforms identify which product lines, customers, or process steps generate highest margins versus resource consumption. Predictive models forecast demand fluctuations, maintenance requirements, and supply chain disruptions enabling proactive resource allocation.
Organizations selecting efficiency-enabling technology should evaluate options using these criteria:
- Integration capability – Does the solution connect with existing systems through APIs, data imports, or native integrations?
- Customization flexibility – Can workflows, forms, and reports adapt to specific operational requirements?
- Scalability – Will the platform support growth in users, transactions, and data volume without performance degradation?
- Implementation complexity – What timeline, resources, and disruption does deployment require?
- Total cost of ownership – Including licensing, implementation, training, maintenance, and support costs over expected lifespan
- Vendor stability and support – Is the provider financially stable with responsive technical support and regular updates?
What Returns Can Organizations Expect from Operational Efficiency Investments?
Operational efficiency programs deliver measurable financial returns through four mechanisms: reduced labor costs, lower material waste, increased asset utilization, and faster revenue conversion.
Labor Cost Reduction – Process optimization and automation eliminate redundant tasks, reduce rework, and accelerate completion times. A distribution center reducing order fulfillment time from 12 minutes to 8 minutes increases throughput capacity 33% without adding staff. Organizations achieving 15-20% labor productivity gains can handle growth without proportional headcount increases or redeploy employees to revenue-generating activities.
Material Waste Minimization – Quality improvements, inventory optimization, and process control reduce scrap, obsolescence, and spoilage. Manufacturing operations decreasing defect rates from 5% to 2% save 3% of material costs while reducing rework labor and delivery delays. Inventory optimization balances stockout prevention against carrying costs and obsolescence risk.
Asset Utilization Enhancement – Maximizing productive time from capital equipment spreads fixed costs across more output units. Increasing machine uptime from 75% to 85% through preventive maintenance and faster changeovers boosts effective capacity 13% without equipment purchases. Managing IT services efficiently ensures technology infrastructure supports operations without excessive downtime or support overhead.
Revenue Cycle Acceleration – Faster order-to-delivery cycles improve cash flow and customer satisfaction. Reducing lead times from 14 days to 7 days enables inventory turns to double, cutting working capital requirements while increasing revenue velocity. CRM systems accelerate sales cycles by automating follow-up, qualifying leads, and routing opportunities to appropriate representatives.
Investment payback periods vary by improvement type:
| Improvement Category | Typical Investment | Payback Period | Ongoing Annual Benefit |
|---|---|---|---|
| Process Redesign | Low (labor only) | 3-6 months | 10-15% cost reduction |
| Workflow Automation | Medium ($25K-$100K) | 12-18 months | 20-30% productivity gain |
| Equipment Upgrade | High ($100K-$1M+) | 24-36 months | 5-10% capacity increase |
| Enterprise Software | High ($50K-$500K) | 18-24 months | 15-25% efficiency gain |
The World Economic Forum’s analysis on supply chains emphasizes balancing efficiency optimization against resilience requirements. Extreme efficiency creates vulnerability to disruptions when organizations eliminate all buffers and redundancy. Optimal efficiency maintains calculated reserves protecting against realistic risk scenarios while avoiding wasteful excess.
How Should Organizations Implement Operational Efficiency Programs?
Successful implementation follows structured phases with executive sponsorship, cross-functional collaboration, and iterative refinement.
Phase 1: Assessment and Baseline (Weeks 1-4)
- Define program scope – specific departments, processes, or value streams targeted
- Map current-state workflows documenting steps, roles, handoffs, cycle times, and resource consumption
- Measure baseline performance across key efficiency metrics
- Identify obvious waste sources and quick-win opportunities
- Establish improvement targets aligned with business objectives
- Secure executive sponsorship and resource commitments
Phase 2: Prioritization and Planning (Weeks 5-8)
- Evaluate improvement opportunities by potential impact, implementation difficulty, and resource requirements
- Select initial projects balancing quick wins demonstrating value against strategic initiatives addressing root causes
- Form cross-functional improvement teams with process ownership and implementation authority
- Develop detailed project plans with milestones, responsibilities, and success criteria
- Communicate program goals, approach, and expected benefits to stakeholders
Phase 3: Design and Testing (Weeks 9-16)
- Redesign selected processes eliminating identified waste and inefficiencies
- Develop or configure technology solutions supporting optimized workflows
- Create standard operating procedures documenting new methods
- Pilot redesigned processes with small user groups collecting feedback
- Refine designs based on pilot results addressing unanticipated issues
- Prepare training materials and change management communications
Phase 4: Implementation and Stabilization (Weeks 17-26)
- Deploy improved processes and supporting technology to full user populations
- Deliver training ensuring users understand new methods and tools
- Provide hands-on support during transition addressing questions and problems
- Monitor performance metrics identifying deviations from expected results
- Adjust procedures and configurations based on real-world experience
- Celebrate successes and recognize contributing teams
Phase 5: Continuous Improvement (Ongoing)
- Track efficiency metrics over time detecting degradation or new opportunities
- Conduct regular process reviews involving frontline employees
- Document lessons learned and successful practices for replication
- Expand proven improvements to additional areas
- Adjust targets as baseline performance improves
Organizations should expect efficiency programs to require 6-12 months from initiation to stabilization with ongoing refinement thereafter. Contract management systems help organizations track vendor performance, compliance obligations, and service level agreements supporting operational consistency.
Programs fail when organizations treat efficiency as one-time projects rather than ongoing capabilities. Sustainable improvements embed measurement, problem-solving, and standardization into daily operations rather than special initiatives. Leadership commitment, resource allocation, and performance accountability must persist beyond initial implementation periods.
Operational efficiency improvements deliver measurable financial returns while enhancing operational resilience and customer satisfaction. Organizations that systematically measure performance, eliminate waste, standardize processes, leverage automation, and engage employees in continuous improvement sustain competitive advantages in increasingly demanding markets. Brytend develops custom software solutions that enable operational efficiency through workflow automation, real-time monitoring, and integrated data management tailored to your specific operational requirements and strategic objectives. Contact our team to discuss how purpose-built technology can accelerate your efficiency initiatives and deliver documented returns.
Frequently Asked Questions About Operational Efficiency
What is operational efficiency?
Operational efficiency is the ratio between what an organization puts into its operations — labor, time, capital, materials — and what it gets out in results. A more operationally efficient business produces the same output with fewer resources, or more output with the same resources.
What is the difference between operational efficiency and operational effectiveness?
Operational efficiency measures how economically you use resources to do something. Operational effectiveness measures whether the thing you did actually achieved the intended result. A team can run a process very efficiently while still being ineffective if the process itself is solving the wrong problem.
What is a synonym for operational efficiency?
Common near-synonyms include “process efficiency,” “operational productivity,” and “resource efficiency.” “Operational effectiveness” is often used interchangeably but is technically distinct, since effectiveness is about outcomes rather than resource use.
How do you measure operational efficiency?
Most organizations track it through ratios such as output per labor hour, cost per unit, cycle time, and utilization rate, then benchmark those ratios against past performance and industry peers rather than relying on a single universal formula.