Sales forecasting methods are the techniques companies use to estimate future revenue, from simple ones such as last year’s numbers plus a growth percentage, to moving averages, exponential smoothing with trend and season, pipeline-based forecasts and expert judgement. The best method depends on how much history you have and how stable your sales are. For most small and mid-sized B2B companies, a time-series method on 24 months of invoiced revenue, combined with the open pipeline and a range instead of one number, gives a forecast that is both accurate and easy to explain.
TL;DR:
- Quantitative methods use your own sales history; qualitative methods use the judgement of people who know the market
- Moving averages are simple but always run behind a trend; exponential smoothing reacts faster
- Holt’s method adds a trend, and a seasonal index handles months that are always busy or quiet
- Pipeline forecasts use open quotes and win rates and work best for the next one to three months
- Always show a range and check accuracy by forecasting past months you already know (a backtest)
A sales forecast is an estimate of the revenue a company will make in a coming period, based on data, assumptions or both.
What Is Sales Forecasting?
Sales forecasting means estimating how much you will sell in the coming weeks, months or year. Finance uses it for cash planning, operations for staffing and stock, and management for targets and investments. A forecast is never exact. Its job is to be close enough and honest about its uncertainty, so people can make better decisions than they would by gut feeling alone.
Forecasting methods fall into two groups:
- Quantitative methods calculate the forecast from historical data, such as invoiced revenue per month
- Qualitative methods rely on the opinion of sales staff, managers or customers, and are used when there is little history or the market is changing
Most companies end up combining both: a calculated baseline, adjusted by people who know about the big project that is coming or the customer who is leaving.
What Are the Main Sales Forecasting Methods?
1. Naive and percentage growth
Take last year’s revenue for the same month and add an expected growth percentage. Forecast = last year’s March x 1.05. It is quick and captures seasonality, but it repeats every one-off spike of last year and ignores recent changes.
2. Moving average
Average the last three, six or twelve months and use that as the forecast. A three-month moving average for April is (January + February + March) / 3. It smooths out noise but always lags behind: if sales are growing, the forecast stays too low.
3. Weighted moving average
Give recent months more weight, for example 50% for last month, 30% for the month before and 20% for the one before that. It reacts faster than a plain average, but you have to pick the weights yourself.
4. Exponential smoothing
Each new forecast is the previous forecast plus a share (alpha) of the last error. New level = alpha x actual + (1 – alpha) x previous level. All past months count, with weights that fade out. It is the standard method for stable series without a clear trend. See exponential smoothing for the maths.
5. Holt’s trend method (and damped trend)
Holt’s method adds a second equation for the trend, so a growing or shrinking business is forecast in the right direction. A damped trend slowly flattens the trend further ahead, which avoids forecasts that grow forever. For business revenue this is often the most reliable time-series method.
6. Seasonal methods
Many businesses are seasonal: service companies get more work before winter, rental companies in summer, calibration labs at the end of the year. A seasonal index per calendar month (for example March = 1.15, August = 0.80) multiplies the baseline forecast. You need at least two full years of data to estimate it reliably.
7. Pipeline and judgement-based forecasting
A pipeline forecast adds up open quotes multiplied by their probability: a quote of 20,000 euro at 50% counts as 10,000. It is strong for the next one to three months and weak beyond that. Expert opinion and the Delphi method, where several people estimate independently and then compare, are used for new products or markets without history.
How Do the Sales Forecasting Methods Compare?
| Method | Data needed | Handles trend | Handles season | Best for |
|---|---|---|---|---|
| Last year + growth % | 12 months | Roughly | Yes | Quick estimates |
| Moving average | 3 to 12 months | No (lags) | No | Stable, flat sales |
| Weighted moving average | 3 to 6 months | Partly | No | Short-term planning |
| Exponential smoothing | 12+ months | No | No | Stable series with noise |
| Holt’s damped trend | 12+ months | Yes | No | Growing or shrinking business |
| Holt + seasonal index | 24+ months | Yes | Yes | Most B2B revenue forecasts |
| Pipeline (weighted quotes) | Open quotes + win rates | n/a | n/a | Next 1 to 3 months |
| Expert opinion / Delphi | None | Depends | Depends | New products, big changes |
What Does a Sales Forecasting Example Look Like?
Suppose a service company invoiced on average 50,000 euro per month last year, grew about 1,000 euro per month in the last year, and December is always about 20% busier than an average month. A Holt forecast with seasonality for next December would be roughly: current level 56,000 + trend 1,000 x 3 months = 59,000, times the December index 1.2 = about 70,800 euro. If the one-step-ahead errors of the past months were around 4,000 euro, an 80% range might be 65,000 to 77,000 euro. That range is as important as the number: it tells finance how much buffer to plan.
Two things often spoil a forecast like this:
- One-off spikes: a single large project in one month lifts every later forecast. Cap extreme months (for example anything far above the median) before you calculate.
- Too little history: with one year of data a seasonal index is just last year’s noise. Use a trend method until you have two years.
How Do You Measure Sales Forecast Accuracy?
The most common measure is MAPE, the mean absolute percentage error: the average of |actual – forecast| / actual over a number of months. A MAPE of 8% means the forecast was on average 8% off.
The fair way to measure it is a backtest. Pretend it is three months ago, forecast the last three months from the data before them, and compare with what really happened. A method that cannot forecast the recent past will not forecast the future either. Show the accuracy next to the forecast so users know how much to trust it.
Other good habits:
- Forecast from complete months only; a half-finished month looks like a drop
- Show a confidence level, and explain it in words (“high: stable history, no recent breaks”)
- Write down the reasons behind manual adjustments so you can learn from them later
Which Sales Forecasting Method Should You Use?
Start with the data you have:
- Less than 12 months: pipeline forecast plus expert judgement
- 12 to 24 months: Holt’s damped trend, plus the pipeline for the next quarter
- 24 months or more: Holt’s damped trend with a seasonal index when the season is clear, plus the pipeline
Avoid black boxes. A forecast that nobody can explain will not be used, however clever it is. A slightly simpler method with a clear explanation (“trend up 2% a month, December usually 20% higher, range 65 to 77k”) gets trusted and acted on.
How Does Brytend Forecast Revenue, Cash and Stock?
Brytend has one forecast engine that is shared by revenue, cash in, stock reorder and the key numbers on the dashboards. It uses your own invoiced history: it starts at the first month with data, caps one-off spikes, uses Holt’s damped trend with parameters chosen by the lowest error, and adds a seasonal index per month when there are 24 months or more and the season is clear. Every forecast comes with an 80% range, a confidence level, an accuracy percentage from a three-month backtest, and the reasons in plain language.
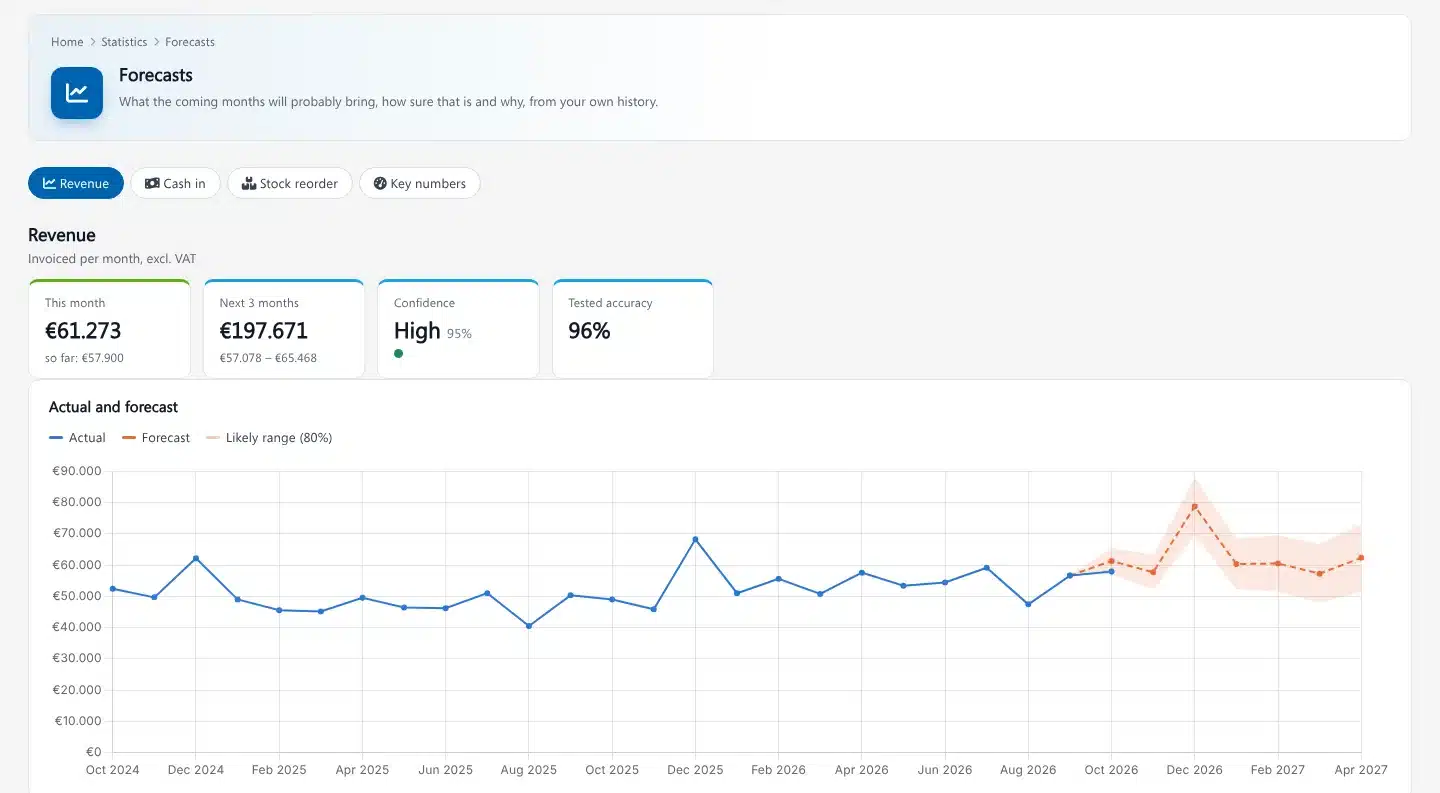
Forecasts appear under Statistics and on the Brytend dashboards, with a what-if to test your own assumptions. Because the numbers come from the same database as invoicing, quotes and stock, there is no export to a spreadsheet and no copy that goes stale. Stock reorder forecasts use the same engine on consumption, which is covered in the inventory control module, and the quote to invoice flow provides the pipeline side.
Frequently Asked Questions About Sales Forecasting Methods
What are the main sales forecasting methods?
The main methods are last year plus a growth percentage, moving averages, weighted moving averages, exponential smoothing, Holt’s trend method, seasonal methods and pipeline or judgement-based forecasting. Most companies combine a calculated baseline with the open pipeline.
What is the most accurate sales forecasting method?
For B2B companies with at least two years of monthly data, Holt’s damped trend with a seasonal index is usually the most accurate time-series method. For the next one to three months, a weighted pipeline forecast adds information the history does not have.
What is the difference between quantitative and qualitative sales forecasting?
Quantitative forecasting calculates the forecast from historical data. Qualitative forecasting uses the judgement of sales staff, managers or experts, and is used when there is little data or the market is changing.
How do you calculate a sales forecast?
Collect complete monthly revenue, remove or cap one-off spikes, apply a method such as Holt’s trend, multiply by a seasonal index if your sales are seasonal, and add a range based on past forecast errors. Then compare with your open pipeline.
How do you measure forecast accuracy?
Use the mean absolute percentage error (MAPE) and test it with a backtest: forecast the last few months from the data before them and compare with the actual results.
How much data do you need for a sales forecast?
You can forecast with 12 months of data using a trend method. To estimate seasonality reliably you need at least 24 months, so every calendar month appears twice.
Can software do sales forecasting automatically?
Yes. Brytend forecasts revenue, cash in and stock from your own invoiced history, with a range, confidence level, tested accuracy and the reasons in plain language, so you do not need to build a spreadsheet model.
No single sales forecasting method is right for every company. Use what your data allows, add a trend and season when you have the history, combine it with your pipeline, and always show a range and a tested accuracy. The best forecast is one people understand and use. Brytend calculates revenue, cash and stock forecasts from your own data and explains every number. Start a free 90-day trial to see your own forecast.