

Software productivity is a measure of how efficiently development teams convert time and resources into functional, deployable code. It encompasses output quality, delivery speed, and resource utilization across the software development lifecycle. Organizations tracking software productivity gain visibility into team performance, project timelines, and areas requiring process improvement.
Note: software productivity measures how efficiently a development team turns time and effort into working software. If you are instead trying to measure how fast an already-built application runs for its end users, see our guide to software performance optimization.
TL;DR:
- Software productivity quantifies development efficiency through metrics like deployment frequency, code quality, and feature delivery rate
- Measurement frameworks include DORA metrics, cycle time, and developer-focused indicators like code churn and review velocity
- Productivity tools automate repetitive tasks, streamline collaboration, and reduce context switching across development workflows
- Individual well-being and emotional state directly correlate with self-assessed productivity in development teams
- Organizations optimize productivity through clear requirements, modern tooling, and continuous process refinement
What Is Software Productivity and How Is It Measured
Software productivity is a quantitative and qualitative assessment of how effectively development teams produce working software within defined timeframes. Measurement requires both objective metrics and subjective assessments.
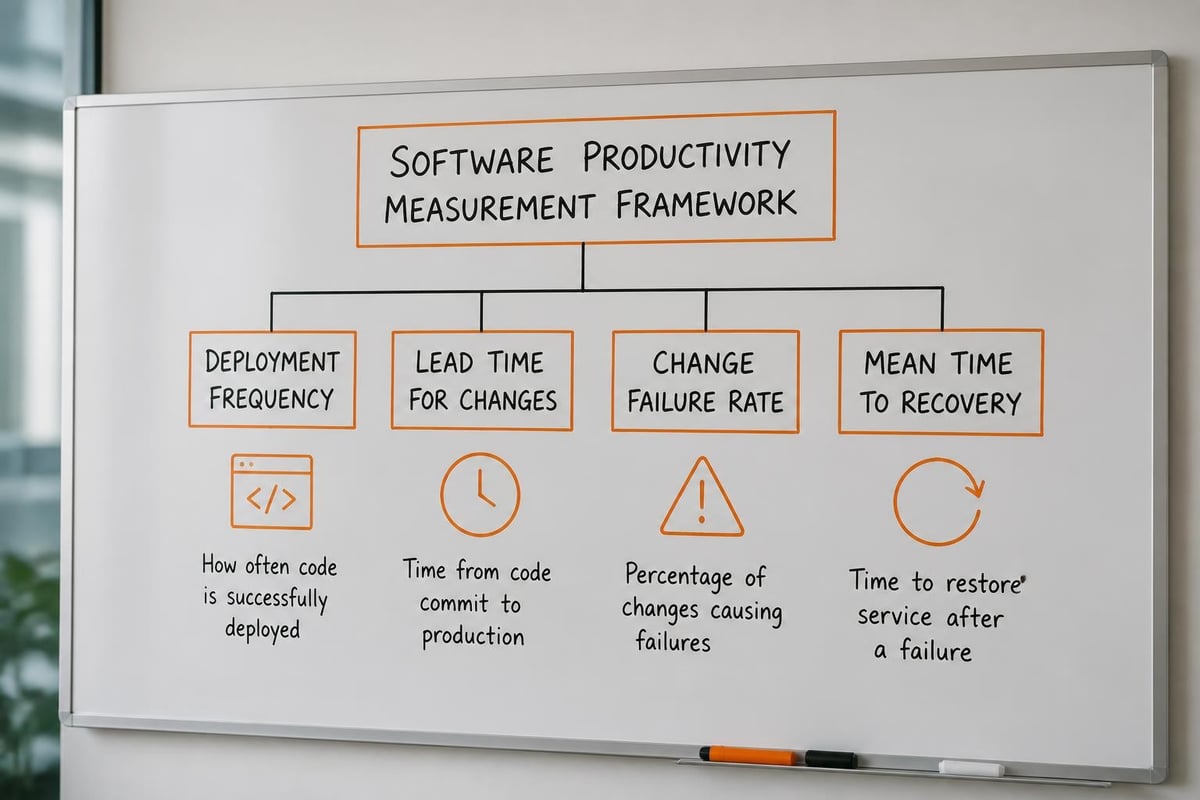
Development organizations use multiple measurement approaches simultaneously. DORA (DevOps Research and Assessment) metrics provide industry-standard benchmarks: deployment frequency, lead time for changes, change failure rate, and mean time to recovery. These four metrics collectively indicate how quickly teams deliver value and how reliably software operates in production.
Cycle time metrics track work progression through development stages:
- Coding time: Active development duration from first commit to pull request
- Review time: Duration from pull request submission to approval
- Deployment time: Duration from merge to production release
- Total cycle time: End-to-end duration from requirement to deployed feature
Additional quantitative indicators include code churn (percentage of code rewritten within 21 days), test coverage percentage, and defect density per thousand lines of code. However, researchers have found that predicting developer productivity using repository data alone presents significant challenges due to individual differences and contextual factors.
Developer-Centric Productivity Indicators
Individual productivity extends beyond code output. Developer experience metrics capture friction points and workflow efficiency. These include build time duration, environment setup time, and documentation accessibility. Teams with faster build times and comprehensive documentation consistently report higher perceived productivity.
Recent validation studies introduce Diff Authoring Time (DAT) as a more accurate productivity metric. DAT measures actual coding time by analyzing commit patterns, providing granular insight into development effort compared to traditional story point estimates.
How Do Productivity Tools Improve Development Workflows
Productivity tools reduce manual overhead and automate repetitive tasks across the development lifecycle. Implementation of appropriate tooling directly increases output capacity without adding headcount.
Integrated development environments (IDEs) with intelligent code completion reduce typing volume by 30-50%. Modern IDEs provide real-time syntax checking, automated refactoring, and inline documentation access. These features eliminate context switching between code editor, documentation, and terminal windows.
Version control platforms integrate with continuous integration/continuous deployment (CI/CD) pipelines to automate testing and deployment. Automated test suites execute on every commit, identifying defects before code review. Deployment automation eliminates manual release processes, reducing deployment time from hours to minutes.
Project management platforms centralize requirements, task assignments, and progress tracking. Teams using structured task management software report clearer priorities and reduced time spent in status meetings. Centralized task visibility prevents duplicate work and clarifies dependencies between team members.
| Tool Category | Primary Function | Productivity Impact |
|---|---|---|
| IDE with AI assistance | Code completion, refactoring | 20-35% faster coding |
| CI/CD pipeline | Automated testing, deployment | 60-80% faster releases |
| Code review platform | Collaborative review, approval | 40-50% faster review cycles |
| Project management | Task tracking, requirements | 25-35% reduced coordination overhead |
Communication tools with threaded conversations and searchable history reduce interruption frequency. Asynchronous communication allows developers to maintain focus during deep work periods while still providing timely responses to questions.
Impact of AI-Powered Development Assistants
Large language model (LLM) assistants now generate code snippets, explain complex functions, and suggest implementation approaches. However, adoption of LLM assistants presents both productivity benefits and code quality risks that organizations must evaluate carefully. Teams report faster initial development but increased time spent validating generated code for security vulnerabilities and logical errors.
What Factors Decrease Software Productivity
Software productivity declines when teams encounter unclear requirements, excessive context switching, and inadequate tooling. Identification and mitigation of these factors prevents productivity loss.
Ambiguous or changing requirements force rework and increase code churn. When developers begin implementation without complete specifications, they build features requiring significant revision. Each revision cycle consumes time that could have been spent on new functionality.
Technical debt accumulates when teams prioritize speed over code quality. Legacy codebases with poor test coverage require more time for bug fixes and feature additions. Each new change risks introducing defects in untested code paths.
Common productivity obstacles:
- Excessive meeting frequency interrupting focused coding time
- Slow build and test execution times exceeding 10 minutes
- Inadequate documentation requiring verbal explanation of system behavior
- Manual deployment processes prone to human error
- Fragmented tooling requiring multiple logins and context switches
Individual developer well-being significantly impacts output. Research demonstrates that affective states correlate strongly with self-assessed productivity, indicating that stress, frustration, and burnout directly reduce development efficiency. Teams experiencing high turnover lose institutional knowledge, requiring new members to rebuild understanding of system architecture and business logic.
How Can Organizations Optimize Software Productivity
Optimization requires systematic process improvement, tooling investment, and team health management. Organizations achieve sustained productivity gains through continuous measurement and refinement.
Establish clear definition of done criteria for each work item. Developers need explicit acceptance criteria defining when a feature is complete. Criteria should specify functional requirements, test coverage thresholds, documentation updates, and deployment verification steps.
Implement automated quality gates in CI/CD pipelines:
- Unit tests must achieve minimum 80% code coverage
- Integration tests must pass for all critical user workflows
- Security scanning must detect zero high-severity vulnerabilities
- Performance tests must meet defined latency thresholds
- Code review approval required from minimum two team members
Reduce context switching by batching similar tasks and protecting focus time. Development teams benefit from designated "no meeting" blocks of 3-4 hours for deep work. Context switching between tasks can reduce productivity by 40% compared to sustained focus on a single task.
Implementing Effective Workflow Systems
Custom software systems tailored to organizational workflows eliminate productivity friction. Brytend specializes in building workflow automation that connects disparate business processes into unified systems. When development teams integrate their project tracking with customer requirements and service delivery, they eliminate manual data synchronization and reduce miscommunication.

Standardize development environments using containerization. When all developers work in identical environments, "works on my machine" issues disappear. Container-based development reduces environment setup time from days to minutes and ensures production parity.
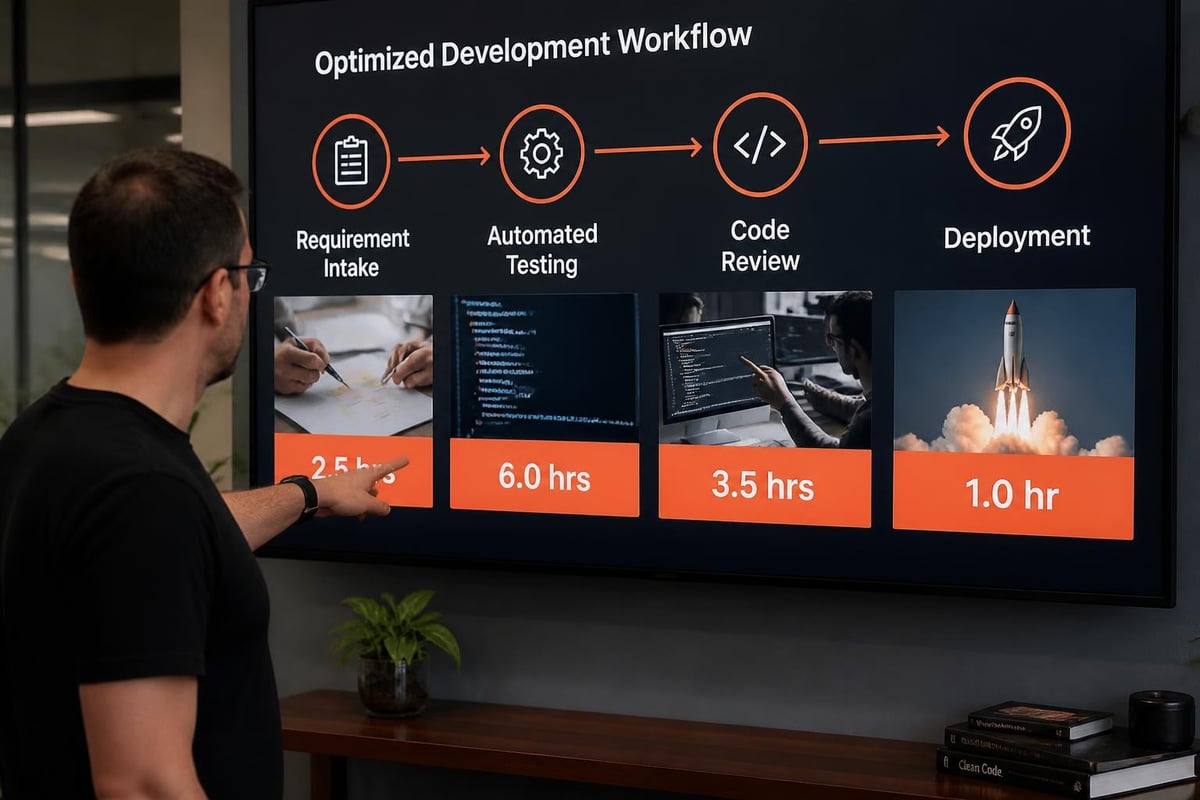
Invest in comprehensive onboarding documentation. New team members should access step-by-step guides for environment setup, architecture overview, coding standards, and common troubleshooting scenarios. Documented processes reduce ramp-up time from months to weeks.
What Are Best Practices for Maintaining High Software Productivity
Sustained productivity requires ongoing attention to process health, technical debt management, and team well-being. Best practices prevent productivity erosion over time.
Allocate dedicated time for technical debt reduction. Reserve 20-25% of development capacity for refactoring, test coverage improvement, and dependency updates. Teams that defer technical debt eventually reach a point where most development time addresses maintenance rather than new features.
Conduct regular retrospectives with actionable outcomes. Effective retrospectives identify specific process improvements rather than general complaints. Each retrospective should produce 2-3 concrete action items with assigned owners and completion dates.
Productivity maintenance practices:
- Code review participation from all team members promotes knowledge sharing
- Pair programming for complex features reduces defects and improves design quality
- Regular dependency updates prevent security vulnerabilities and compatibility issues
- Performance profiling identifies bottlenecks before they impact users
- Automated alerting detects production issues immediately
Monitor leading indicators of productivity decline. Increasing pull request review time, growing backlog of unresolved bugs, and declining deployment frequency all signal process problems. Address these indicators before they compound into major productivity losses.
Case example: A financial services development team reduced deployment frequency from weekly to monthly over six months due to increasing manual testing requirements. After implementing automated regression testing and standardizing deployment procedures, they restored weekly deployments and reduced release preparation time from 16 hours to 2 hours.
Manual vs Automated Development Workflows
| Aspect | Manual Process | Automated Process |
|---|---|---|
| Test execution | 2-4 hours per release | 15-30 minutes per commit |
| Deployment | 1-3 hours, error-prone | 10-20 minutes, repeatable |
| Code review | Email-based, slow | Platform-integrated, tracked |
| Environment setup | 1-3 days | 30-60 minutes |
| Regression detection | Days to weeks | Minutes to hours |
Track developer satisfaction through regular surveys. Satisfied developers demonstrate higher productivity, lower defect rates, and longer tenure. Survey questions should assess tooling adequacy, requirement clarity, workload sustainability, and collaboration effectiveness.
What Metrics Should Development Teams Track
Effective metric tracking balances quantitative output measures with qualitative indicators of code health and team well-being. Teams should monitor 5-7 core metrics rather than attempting comprehensive measurement.
Primary output metrics include deployment frequency and lead time for changes. Deployment frequency indicates how often teams deliver value to production. Lead time measures the duration from requirement specification to deployed feature, revealing bottlenecks in the development process.
Software productivity metrics dashboard displaying deployment frequency, lead time, change failure rate, test coverage, and code review velocity with trend indicators
Quality metrics include change failure rate and mean time to recovery. Change failure rate measures what percentage of deployments cause production incidents. Mean time to recovery indicates how quickly teams restore service after incidents. Together, these metrics reveal whether speed improvements compromise reliability.
Process efficiency metrics track waste and bottlenecks:
- Pull request review time: Time from submission to approval
- Build duration: Time required for compilation and test execution
- Code churn rate: Percentage of code modified within three weeks of writing
- Test coverage percentage: Lines of code executed by automated tests
- Defect escape rate: Bugs discovered in production versus caught in development
Individual developer metrics require careful implementation to avoid counterproductive behavior. Lines of code written and commits per day incentivize quantity over quality. Instead, track metrics that reflect sustainable productivity: code review participation, documentation contributions, and knowledge sharing activities.
Create visibility dashboards accessible to all team members. Transparency builds accountability and allows teams to self-correct when metrics trend negatively. Dashboards should update automatically from integrated development tools rather than requiring manual data entry.
Balance metrics prevent gaming and misinterpretation. High deployment frequency without corresponding quality metrics might indicate rushed releases. Low defect counts without test coverage data might reflect inadequate testing rather than quality code.
Organizations seeking to implement comprehensive productivity measurement benefit from custom software development that integrates metrics collection across their specific toolchain and workflows. Generic analytics platforms miss organizational context that custom solutions capture.
How Does Team Structure Affect Software Productivity
Team organization directly influences communication overhead, decision-making speed, and individual accountability. Optimal team structure varies by project scope and organizational culture.
Small teams of 5-7 developers minimize communication overhead and decision latency. As team size increases, coordination complexity grows exponentially. Teams exceeding 10 members require formal coordination mechanisms that reduce individual productivity through increased meeting time and approval layers.
Cross-functional teams including developers, quality assurance, and operations reduce handoff delays. When all required expertise resides within one team, members collaborate directly rather than creating tickets for other departments. Cross-functional structure reduces cycle time by 30-50% compared to siloed organizational models.
Clear role definition prevents duplicate effort and coverage gaps. Each team member should own specific components or features with defined responsibility boundaries. Ambiguous ownership leads to either multiple people working on the same task or critical work remaining unassigned.
Remote and distributed teams face unique productivity challenges. Time zone differences delay synchronous communication and extend feedback loops. Distributed teams require deliberate investment in documentation, asynchronous communication practices, and periodic in-person collaboration to maintain productivity comparable to co-located teams.
Flat organizational structures with minimal management layers accelerate decision-making. Developers who can deploy changes without multiple approval stages ship features faster. However, autonomy requires strong technical judgment and shared understanding of quality standards.
Software productivity optimization requires balancing quantitative metrics, appropriate tooling, clear processes, and team well-being. Organizations that systematically measure productivity, invest in automation, and maintain healthy development practices achieve sustainable competitive advantage through faster, more reliable software delivery. Brytend builds custom software solutions that integrate productivity tracking, workflow automation, and team collaboration into unified systems tailored to your specific development processes and business requirements.
Frequently Asked Questions About Software Productivity
What is software productivity?
Software productivity measures how efficiently a development team converts time and resources into functional, deployable code — covering output volume, delivery speed, and quality, not just lines of code written.
How do you measure software productivity?
Common measures include story points or features delivered per sprint, cycle time from commit to production, deployment frequency, and defect rates, always read alongside each other rather than in isolation, since any single metric can be gamed.
What are common productivity metrics in software engineering?
Widely used metrics include lead time for changes, deployment frequency, change failure rate, and mean time to recovery (the four DORA metrics), plus team-level measures like cycle time and story throughput.
Is software productivity the same as software performance?
No. Software productivity is about how efficiently a team builds and ships software. Software performance is about how fast and reliably the finished software runs for its users. A highly productive team can still ship an application with performance problems, and vice versa.